plot(mtcars$hp, mtcars$mpg, xlab = "hp", ylab = "mpg", main = "Cars fuel usage")
Den här sidan samlar lite kommandon i den s k base-R
dialekten av R.
plot(mtcars$hp, mtcars$mpg, xlab = "hp", ylab = "mpg", main = "Cars fuel usage")
table(titanic$Survived)
Alive  Dead
  712  1496
eller om man vill ha en tabell med andelar
prop.table(table(titanic$Survived))
    Alive      Dead
0.3224638 0.6775362 barplot(prop.table(table(titanic$Survived)), ylab = "proportion")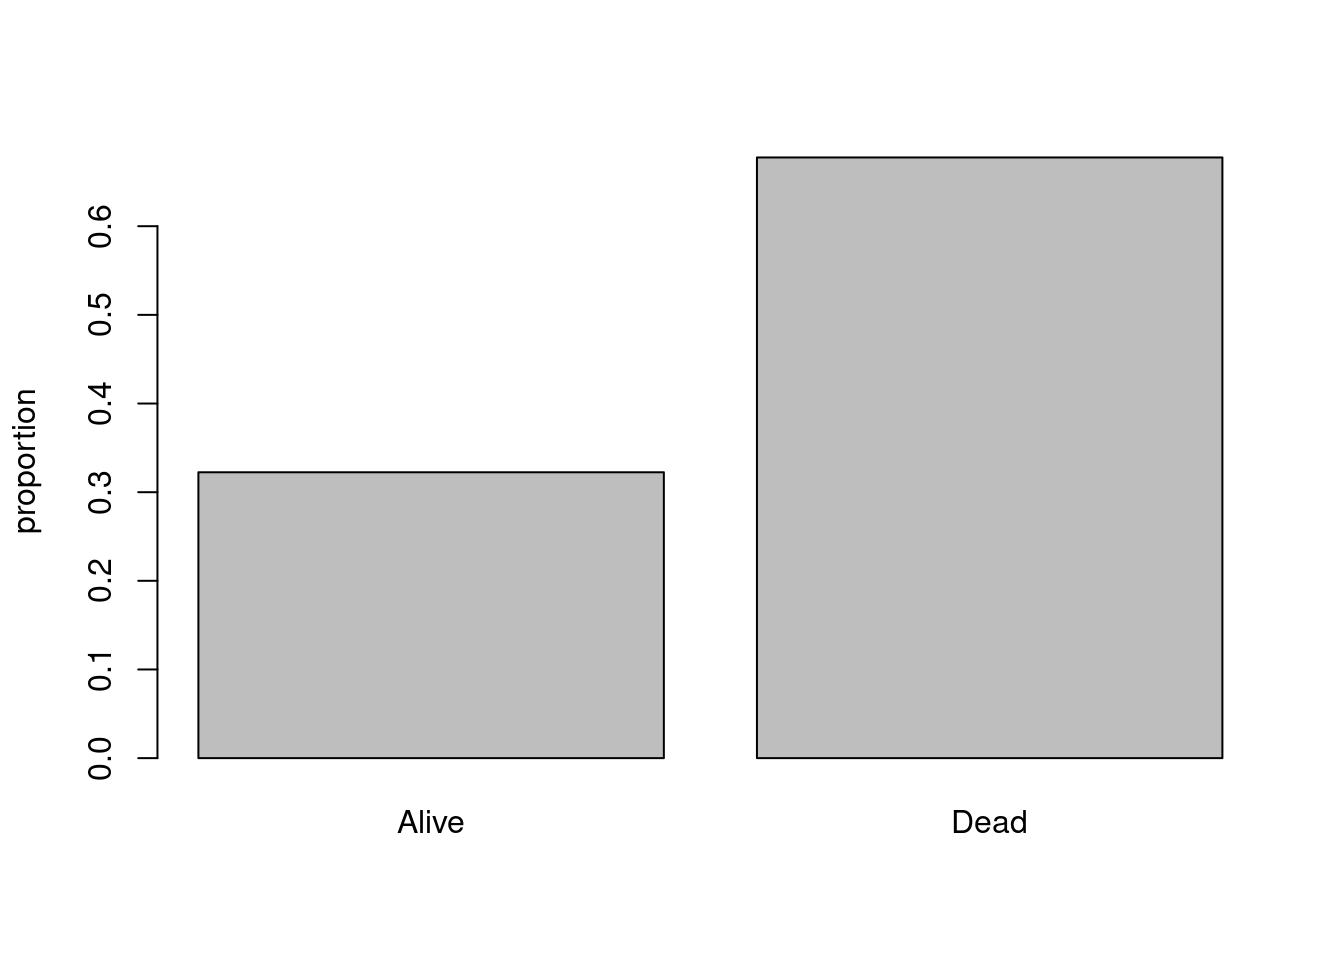
hist(titanic$Age)
load(file = url("https://github.com/StatisticsSU/SDA1/blob/main/datorlab/lab3/FevChildren.RData?raw=true"))
fev_list <- split(FevChildren$fev, FevChildren$age.group)
n <- length(fev_list)
Sorted_age.group <- sort(unique(FevChildren$age.group))
par(mfrow = c(1,3))
for(i in 1:n){
  hist(fev_list[[i]], main = paste("FEV given age.group", Sorted_age.group[i]),
       xlab = "FEV", col = "lightblue", ylim = c(0, 1), probability = TRUE)
}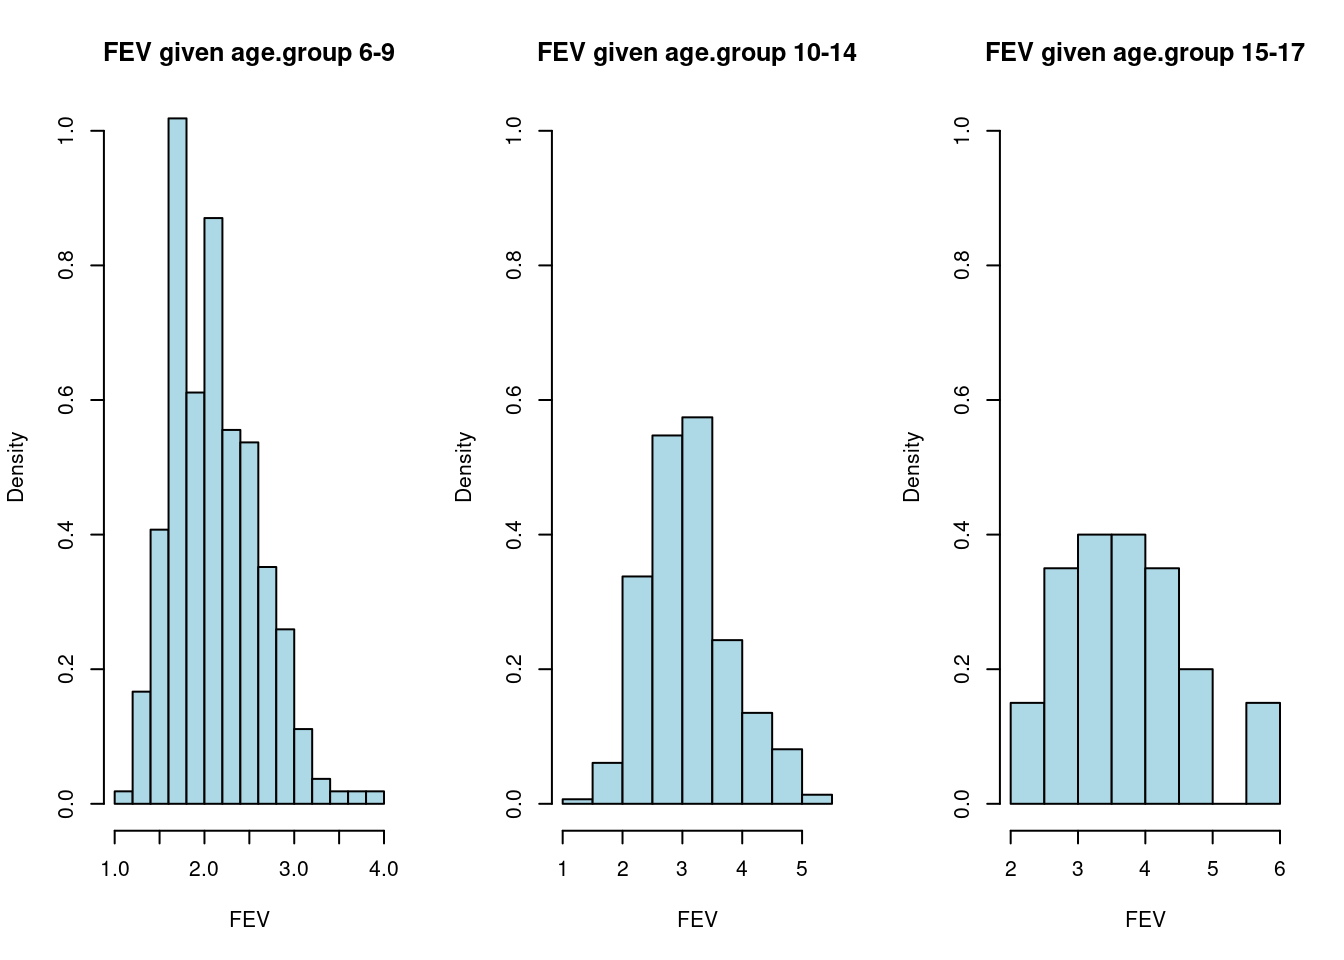
par(mfrow = c(1,1))
hist(fev_list[[1]], main = paste("Histogram of fev given age.group"), xlab = "FEV",
     col = 2, probability = TRUE, xlim = c(1, 8))
for(i in 2:n){
  hist(fev_list[[i]], add = TRUE, col = i+1, probability =  TRUE)
}
legend("topright", legend = c("6-9", "10-14", "15-17"), fill = c(2, 3, 4))